Hive Financial Statistics – 2021.09.08

Welcome to the daily financial report about the Hive blockchain.
All the information presented in this report is based on the data collected from the blockchain until 2021-09-08 midnight UTC. This report aims to provide you with a clear view of what is happening on the Hive blockchain.
1. Price
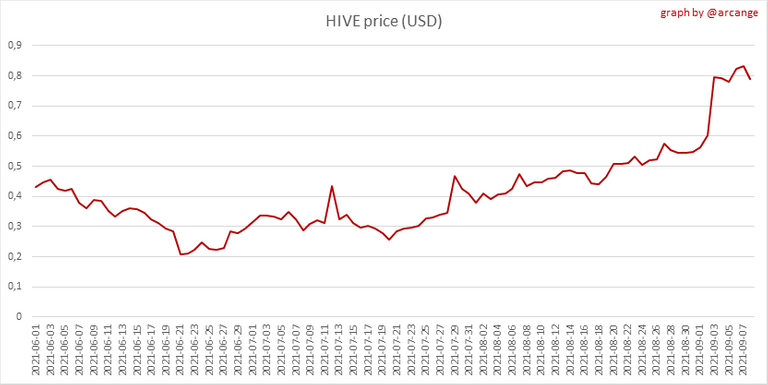 | 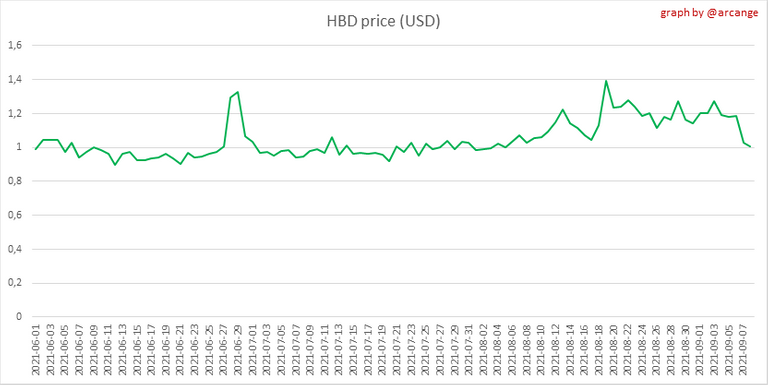 |
These graphs show the evolution of prices in USD for HIVE and HBD.
2. Supply
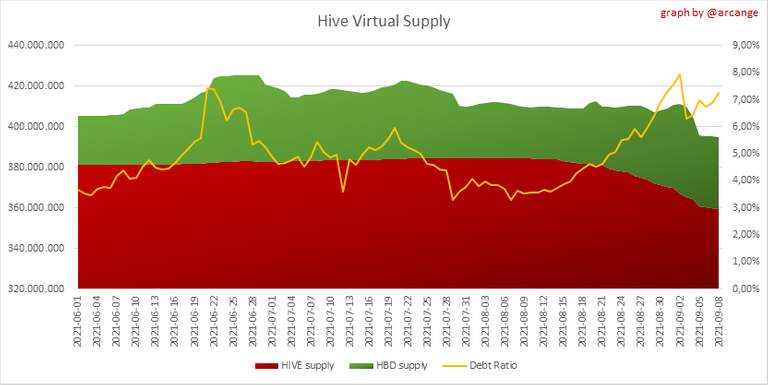
This graph shows the evolution of HIVE virtual Supply. The virtual supply is the sum of HIVE supply (liquid Or staked HIVE) and HBD supply (converted into HIVE).
The graph also displays the debt ratio (HBD supply / HIVE virtual supply). Keep in mind that since hardfork 24 funds in the treasury (@hive.fund HBD balance) don't count towards the HBD debt ratio
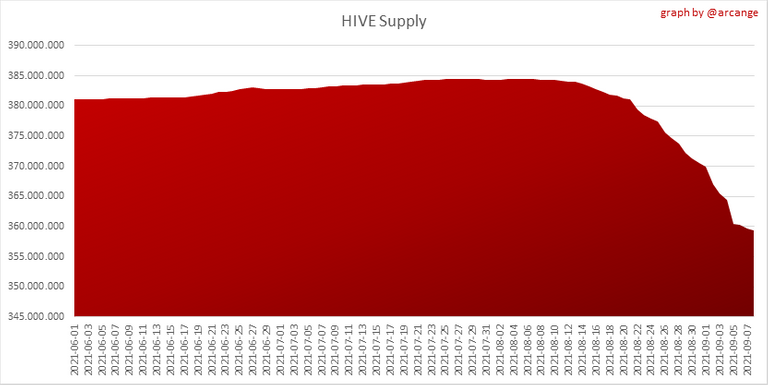 | 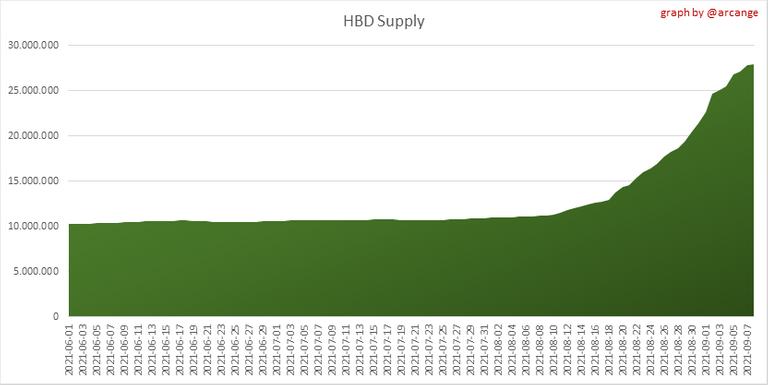 |
These graphs show the evolution of the HIVE Supply (both liquid and staked) and the HBD supply.
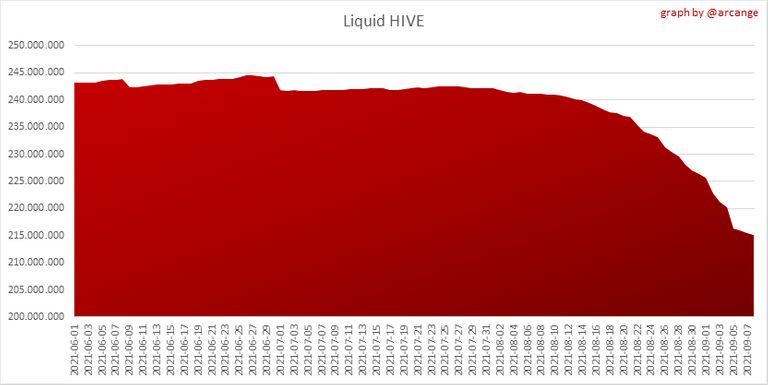 | 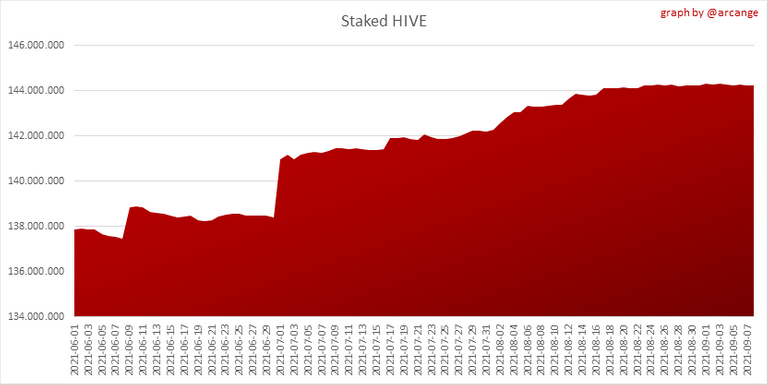 |
These charts show the evolution of the liquid HIVE and the staked HIVE (Hive Power).
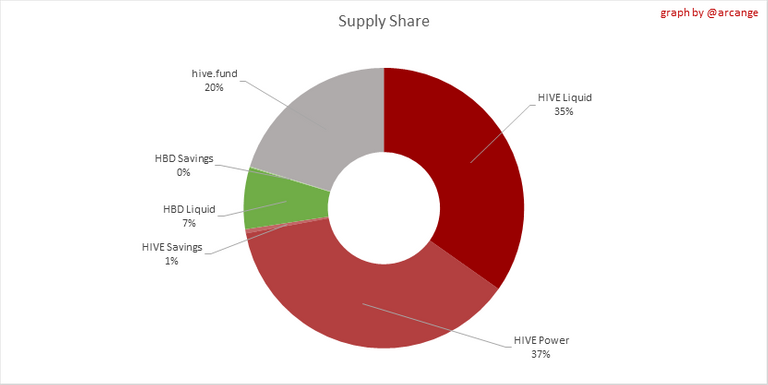
This graph shows the overall Hive tokens distribution
3. HBD Savings
Note: As of 2021-06-30 (HF25) interest is only paid for HBD which are stored in savings.
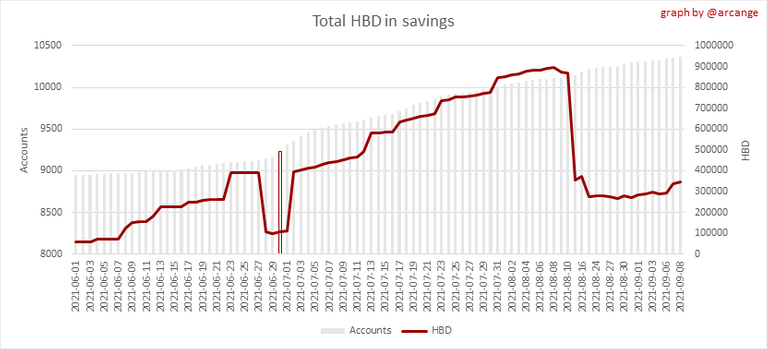
This graph shows how much and how many accounts store HBD in savings.
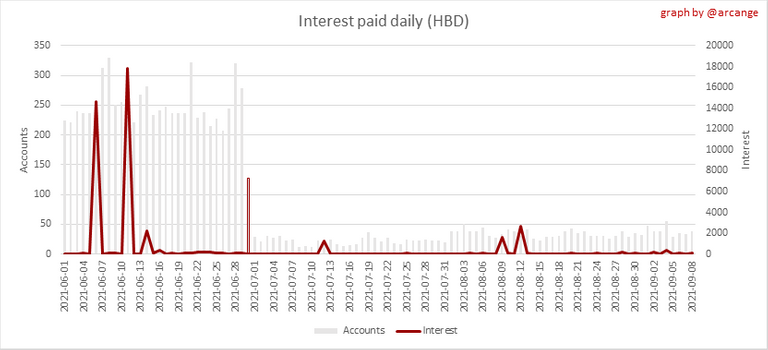
This chart shows the amount of interest paid each day for holding HBD and how many accounts received such interest.
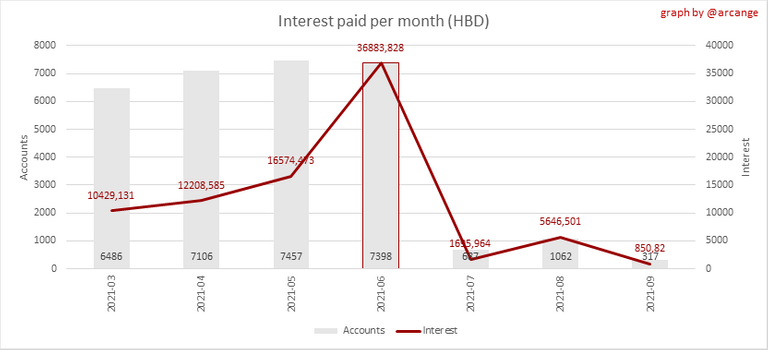
This chart is the same as the previous one, but data are grouped by month.
4. Balances
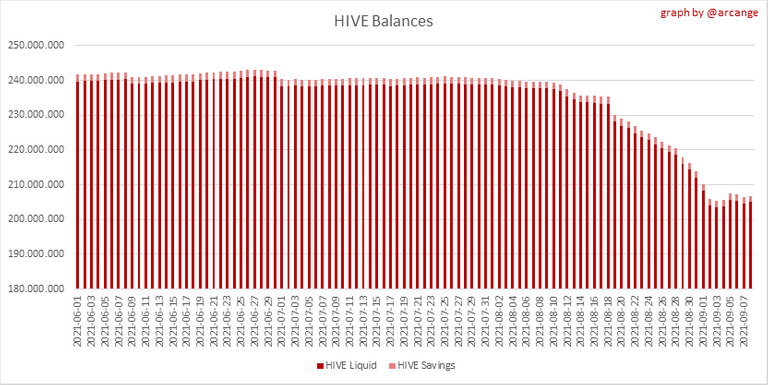
This graph shows the number of HIVE, both liquid and in savings, held by all accounts.

This graph shows the number of HBD, both liquid and in savings, held by all accounts
5. Conversions
Note: As a reminder, conversion requests are only finalized after 3 days. It is only then that it is known exactly how many HIVE were burned in return for the HBD received at the time of the conversion request.
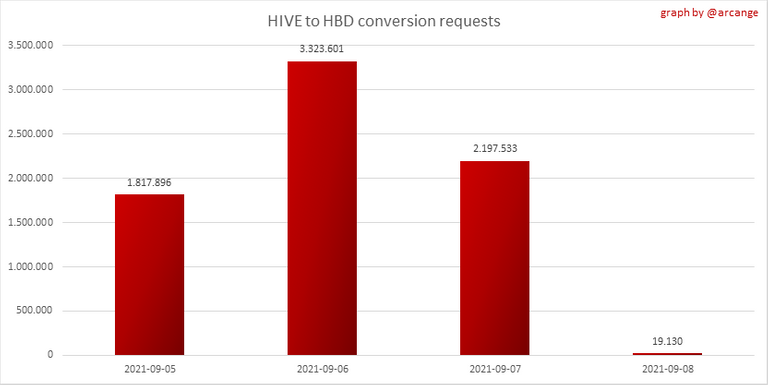
This graph shows the number of HIVE collateralized due to requests to convert HIVE to HBD over the past few days.
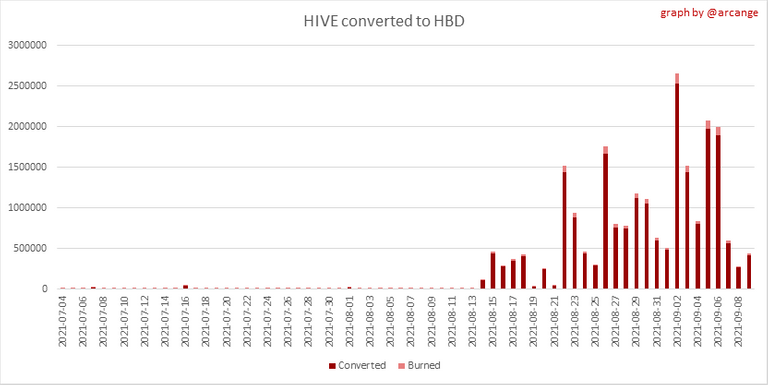 | 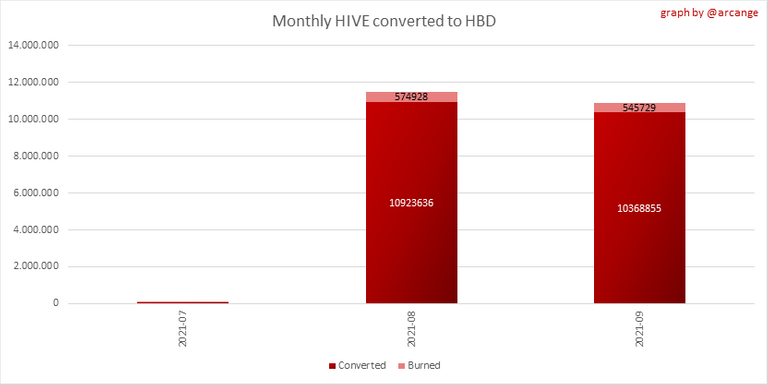 |
These graphs show the number of HIVE effectively used by the conversion process (HIVE converted and 5% HIVE fee which is burned) each day and month when requests to convert HIVE to HBD have been finalized.
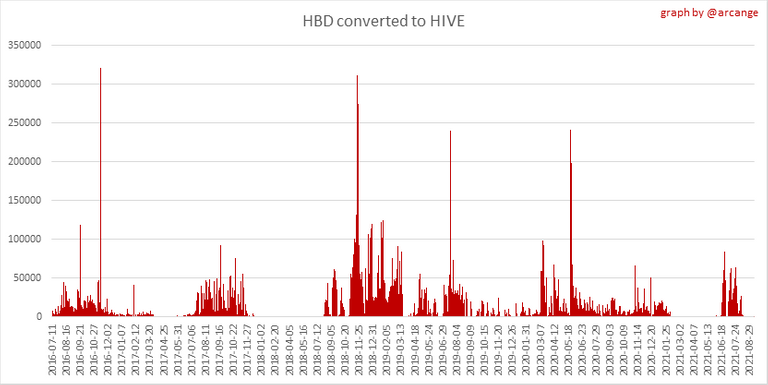 | 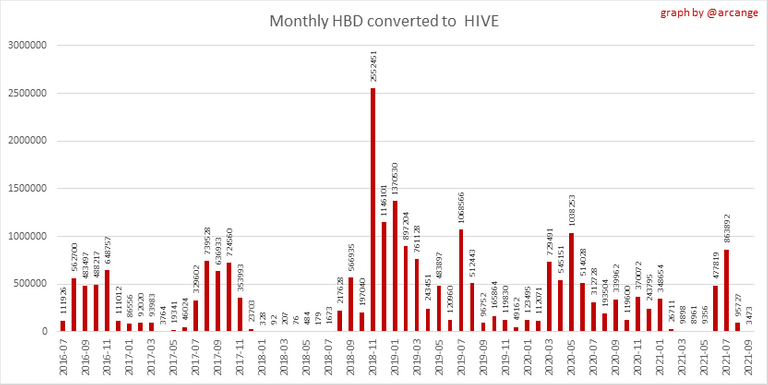 |
These graphs show the number of HBD burned, each day and each month, following requests to convert HBD to HIVE.
6. Power Up and Down
| Date | Account | Amount |
|---|---|---|
| 2021-09-08 01:04:21 | @digital-wisdom | 25,723.062 HIVE |
| 2021-09-08 03:51:48 | @dalz | 23,472.039 HIVE |
| 2021-09-08 09:07:09 | @davedickeyyall | 22,178.177 HIVE |
| 2021-09-08 01:04:48 | @mark-waser | 17,572.408 HIVE |
| 2021-09-08 02:57:15 | @bhllc | 15,385.678 HIVE |
| 2021-09-08 03:55:30 | @altonos | 12,179.367 HIVE |
| 2021-09-08 11:20:36 | @freddio | 5,969.447 HIVE |
| 2021-09-08 10:27:51 | @alokkumar121 | 5,200.246 HIVE |
| 2021-09-08 06:06:33 | @mustangboy | 5,000.523 HIVE |
| 2021-09-08 06:06:48 | @mustangboy | 5,000.523 HIVE |
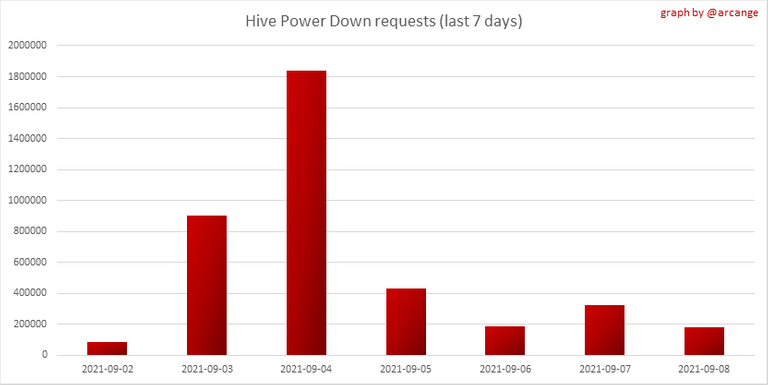
This graph and table show the amount of power down initiated over the last 7 days, and who initiated the largest yesterday.
| Account | Power Up | Account | Powerdown |
|---|---|---|---|
| @vanje | 2,421.000 HIVE | @ocdb | 15,218.491 HIVE |
| @dcrops | 1,378.080 HIVE | @aggroed | 3,622.091 HIVE |
| @straightforward | 1,227.000 HIVE | @felixxx | 3,125.919 HIVE |
| @jphamer1 | 1,108.906 HIVE | @nathanmars | 3,121.656 HIVE |
| @pegasos | 517.937 HIVE | @jeenger | 2,732.437 HIVE |
| @rapp | 471.055 HIVE | @followbtcnews | 2,703.962 HIVE |
| @orinoco | 400.880 HIVE | @pharesim | 2,479.875 HIVE |
| @hansgans | 165.000 HIVE | @jphamer1 | 2,308.906 HIVE |
| @dwcrypt7g | 163.529 HIVE | @ocd-witness | 2,053.505 HIVE |
| @tdctunes | 150.000 HIVE | @reward.app | 1,801.173 HIVE |
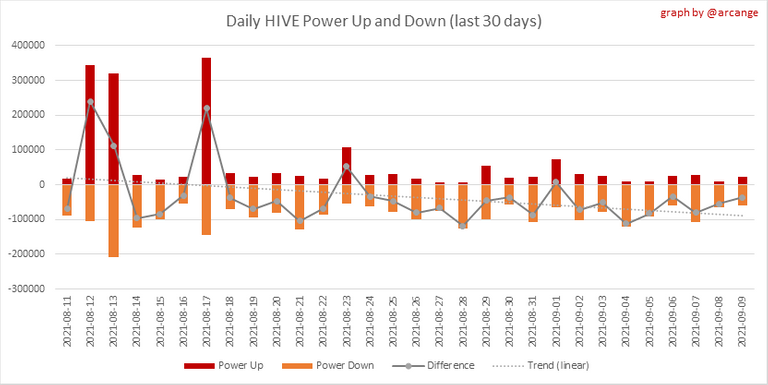
This graph shows the daily HIVE power-up, power-down, and the resulting variation over the last 30 days. The table shows the topmost power-ups and power-downs of the day.

This graph shows the monthly HIVE power-up, power-down and the resulting variation.
Values for the last 3 months
| Period | Powerup | Powerdown | Difference |
|---|---|---|---|
| 2021-09 | 691,414.000 | 210,258.000 | -481,156.000 |
| 2021-08 | 3,144,598.000 | 3,212,814.000 | 68,216.000 |
| 2021-07 | 3,415,366.000 | 5,186,384.000 | 1,771,018.000 |
7. Transfers
These graphs show the volume (in USD) of HIVE and HBD transferred between accounts.
8. Exchanges
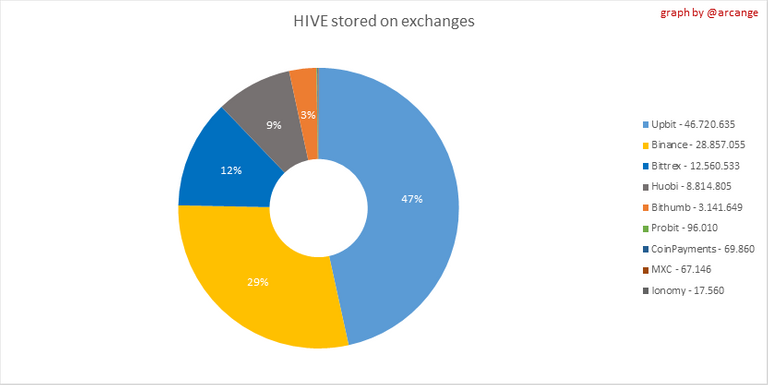 | 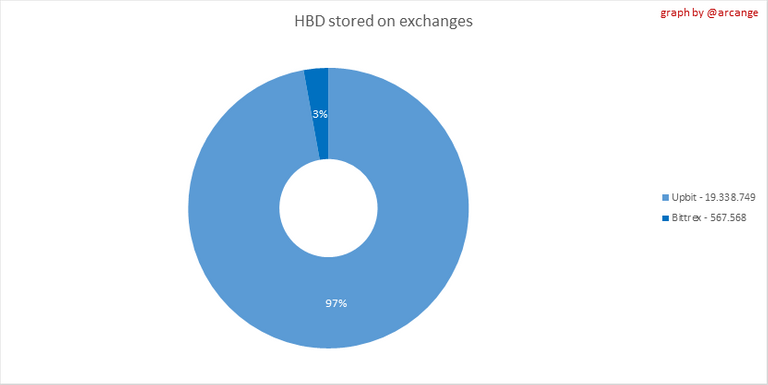 |
These graphs show the amount and distribution of HIVE and HBD stored on the exchanges where they are listed.
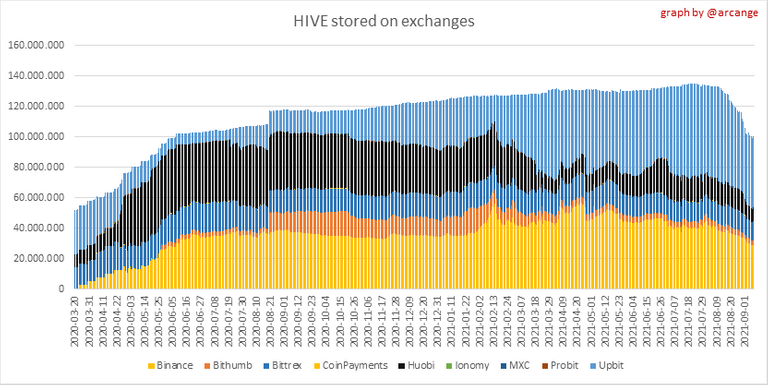 | 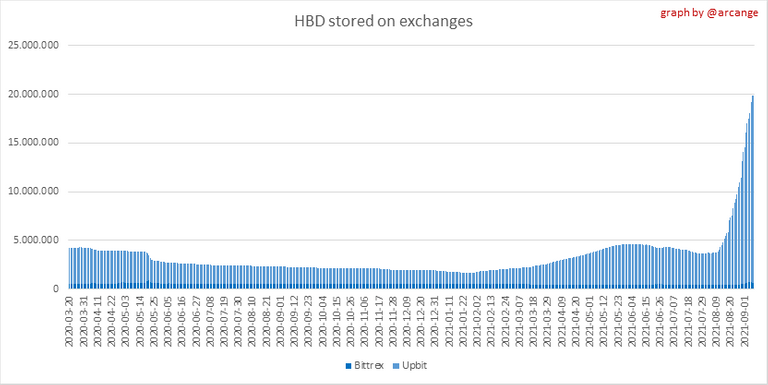 |
These graphs show the daily evolution of HIVE and HBD stored on the exchanges where they are listed.
I hope you find those stats useful. If you would like to see different stats, feel free to drop me a comment. Your feedback is more than welcome.
Thanks for reading.
Check out my apps and services


La liquidità degli hive cala ogni giorno...
https://twitter.com/hiro_hive/status/1436141235945685014
The rewards earned on this comment will go directly to the person sharing the post on Twitter as long as they are registered with @poshtoken. Sign up at https://hiveposh.com.
!PIZZA
!BEER
@arcange! I sent you a slice of $PIZZA on behalf of @eii.
Did you know you can trade $PIZZA on Hive-Engine, Tribaldex, or LeoDex? (1/10)
Congratulations @arcange! You have completed the following achievement on the Hive blockchain and have been rewarded with new badge(s) :
Your next payout target is 72000 HP.
The unit is Hive Power equivalent because your rewards can be split into HP and HBD
You can view your badges on your board and compare yourself to others in the Ranking
If you no longer want to receive notifications, reply to this comment with the word
STOPTo support your work, I also upvoted your post!
Check out the last post from @hivebuzz: