Introduction of Technical Indicators for Cryptocurrency Trading


Hello and warm welcome to all of you. Hope so all are fine and making these days more and more interesting. Today I am here to give brief idea about the using of basic indicator for trading purpose. Before starting the trading it is compulsory for all to learn about the basics of indicator. If we enter the market without any idea about the indicators then this will result in the loss of our assets. There are different kind of strategies by which we can predict the market setup. These include support, resistance strategy, using of indicators and also Fibonacci sequence. These are very helpful in predicting the market trends.
Here in this lecture I will talk about different indicator which will help in understanding weather the market will go in bearish direction or in bullish direction. When the market is bullish it means that price will move in upward direction and when the market is bearish this means prices will go down. Actually there are different types of trading that includes spot trading where we buy cryptocurrency when market value of the token is low and sell when market value is high. Other is future trading where we can trade sell Short when market is going down and when market is going upward we can trade as buy long. So here I will talk about different indicators
Parabolic Stop and Reverse Indicator |
|---|
Parabolic SAR stands for parabolic stop and reverse indicator. In parabolic SAR price changes of market trends are indicated with the help of dots. These dots are present above the graph and below the graph of price movement chart as we can see in below screen shot representing the price of BTC/USD of four hour candle.
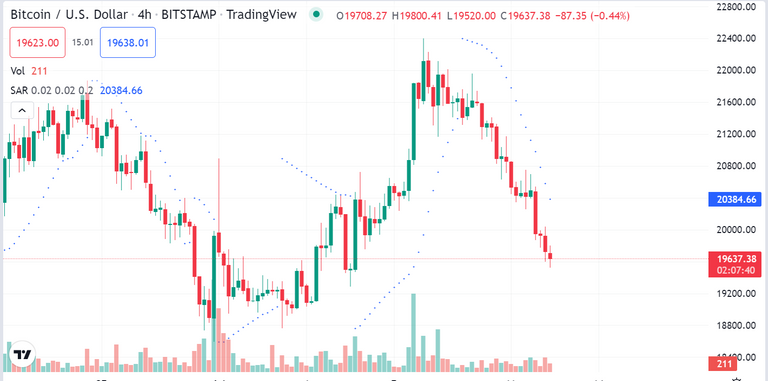
Image is taken from trading view
When dots are present above the chart which represents the price of BTC/USD pair it means that market will go down. When these dots are present below the price chart this will indicates the upward movement of the market. One thing should be noted here that we should exit or enter the market after forming two to three dots not after forming a single dot.
Triple Exponential Moving Average Indicator |
|---|
When we have to do short term trading or scalp trading then we used TEMA Indicator. This indicator is a part of average indicator that contains two exponential moving average and one simple moving average and these three combined to form Triple Exponential Moving Average Indicator.
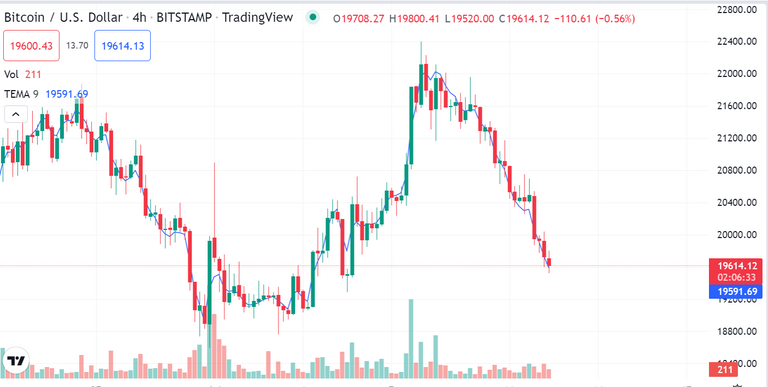
Image is taken from trading view
This indicator is represented by a single line that is present above or below the chart showing market price of cryptocurrency assets. When TEMA line is below the price chart then we should go for buy long trade and if that line moves to above the price chart then we should go for sell short in future wallet.
Exponential Moving Average Indicator with two different average strategy |
|---|
Here Exponential Moving Average Indicator is used with two different days average. Here One is used of 30 days moving average while other is of 21 days moving average as shown in below screenshot.
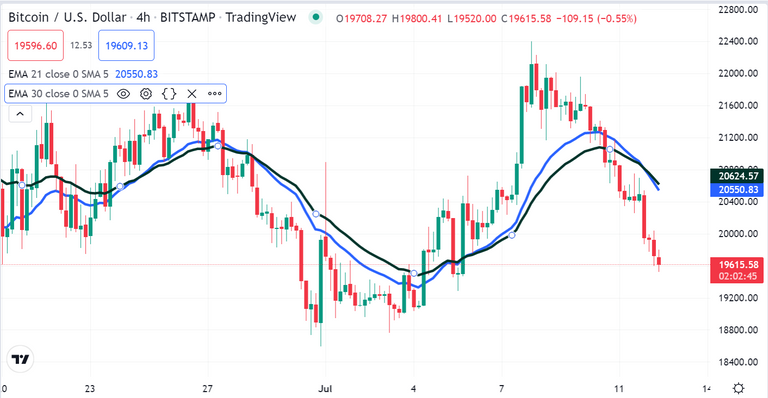
Image is taken from trading view
When long days moving average (here 30 days) cross the short days moving average and then start moving upward this will shows the bearish trend of the market. When short days or less days moving average cross the long days moving average and then start moving up from short days then market will goes to bullish way.
Relative Strength Indicator |
|---|
It is a type of indicator which consist of total 100 value. It is divided into two parts. When the value of RSI is below 30 then it indicates that market is in condition of oversold and here we should go for buy
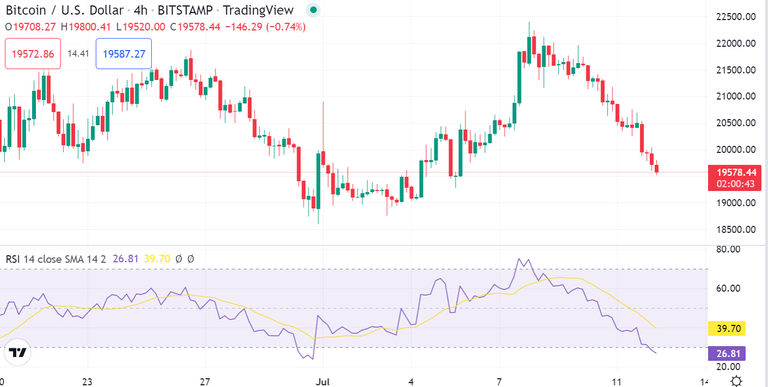
Image is taken from trading view
When the value of RSI is above 70 which indicates that market is in condition of overbought and after that it will start declining. So we should take entry when value of RSI is below 40 and exit from market when value of RSI is above 70.
Congratulations @alihussain077! You have completed the following achievement on the Hive blockchain and have been rewarded with new badge(s):
Your next target is to reach 300 upvotes.
You can view your badges on your board and compare yourself to others in the Ranking
If you no longer want to receive notifications, reply to this comment with the word
STOPSupport the HiveBuzz project. Vote for our proposal!